GO Transit ridership update – how is your station or line doing?
The latest stats are in and show record-breaking ridership numbers for GO Transit.
Feb 13, 2020
As Valentine’s approaches, GO Transit is feeling the love.
The latest ridership map and report, which will be presented at the Feb. 20 public Metrolinx board meeting, shows a record number of customers using GO across the Greater Golden Horseshoe Region.

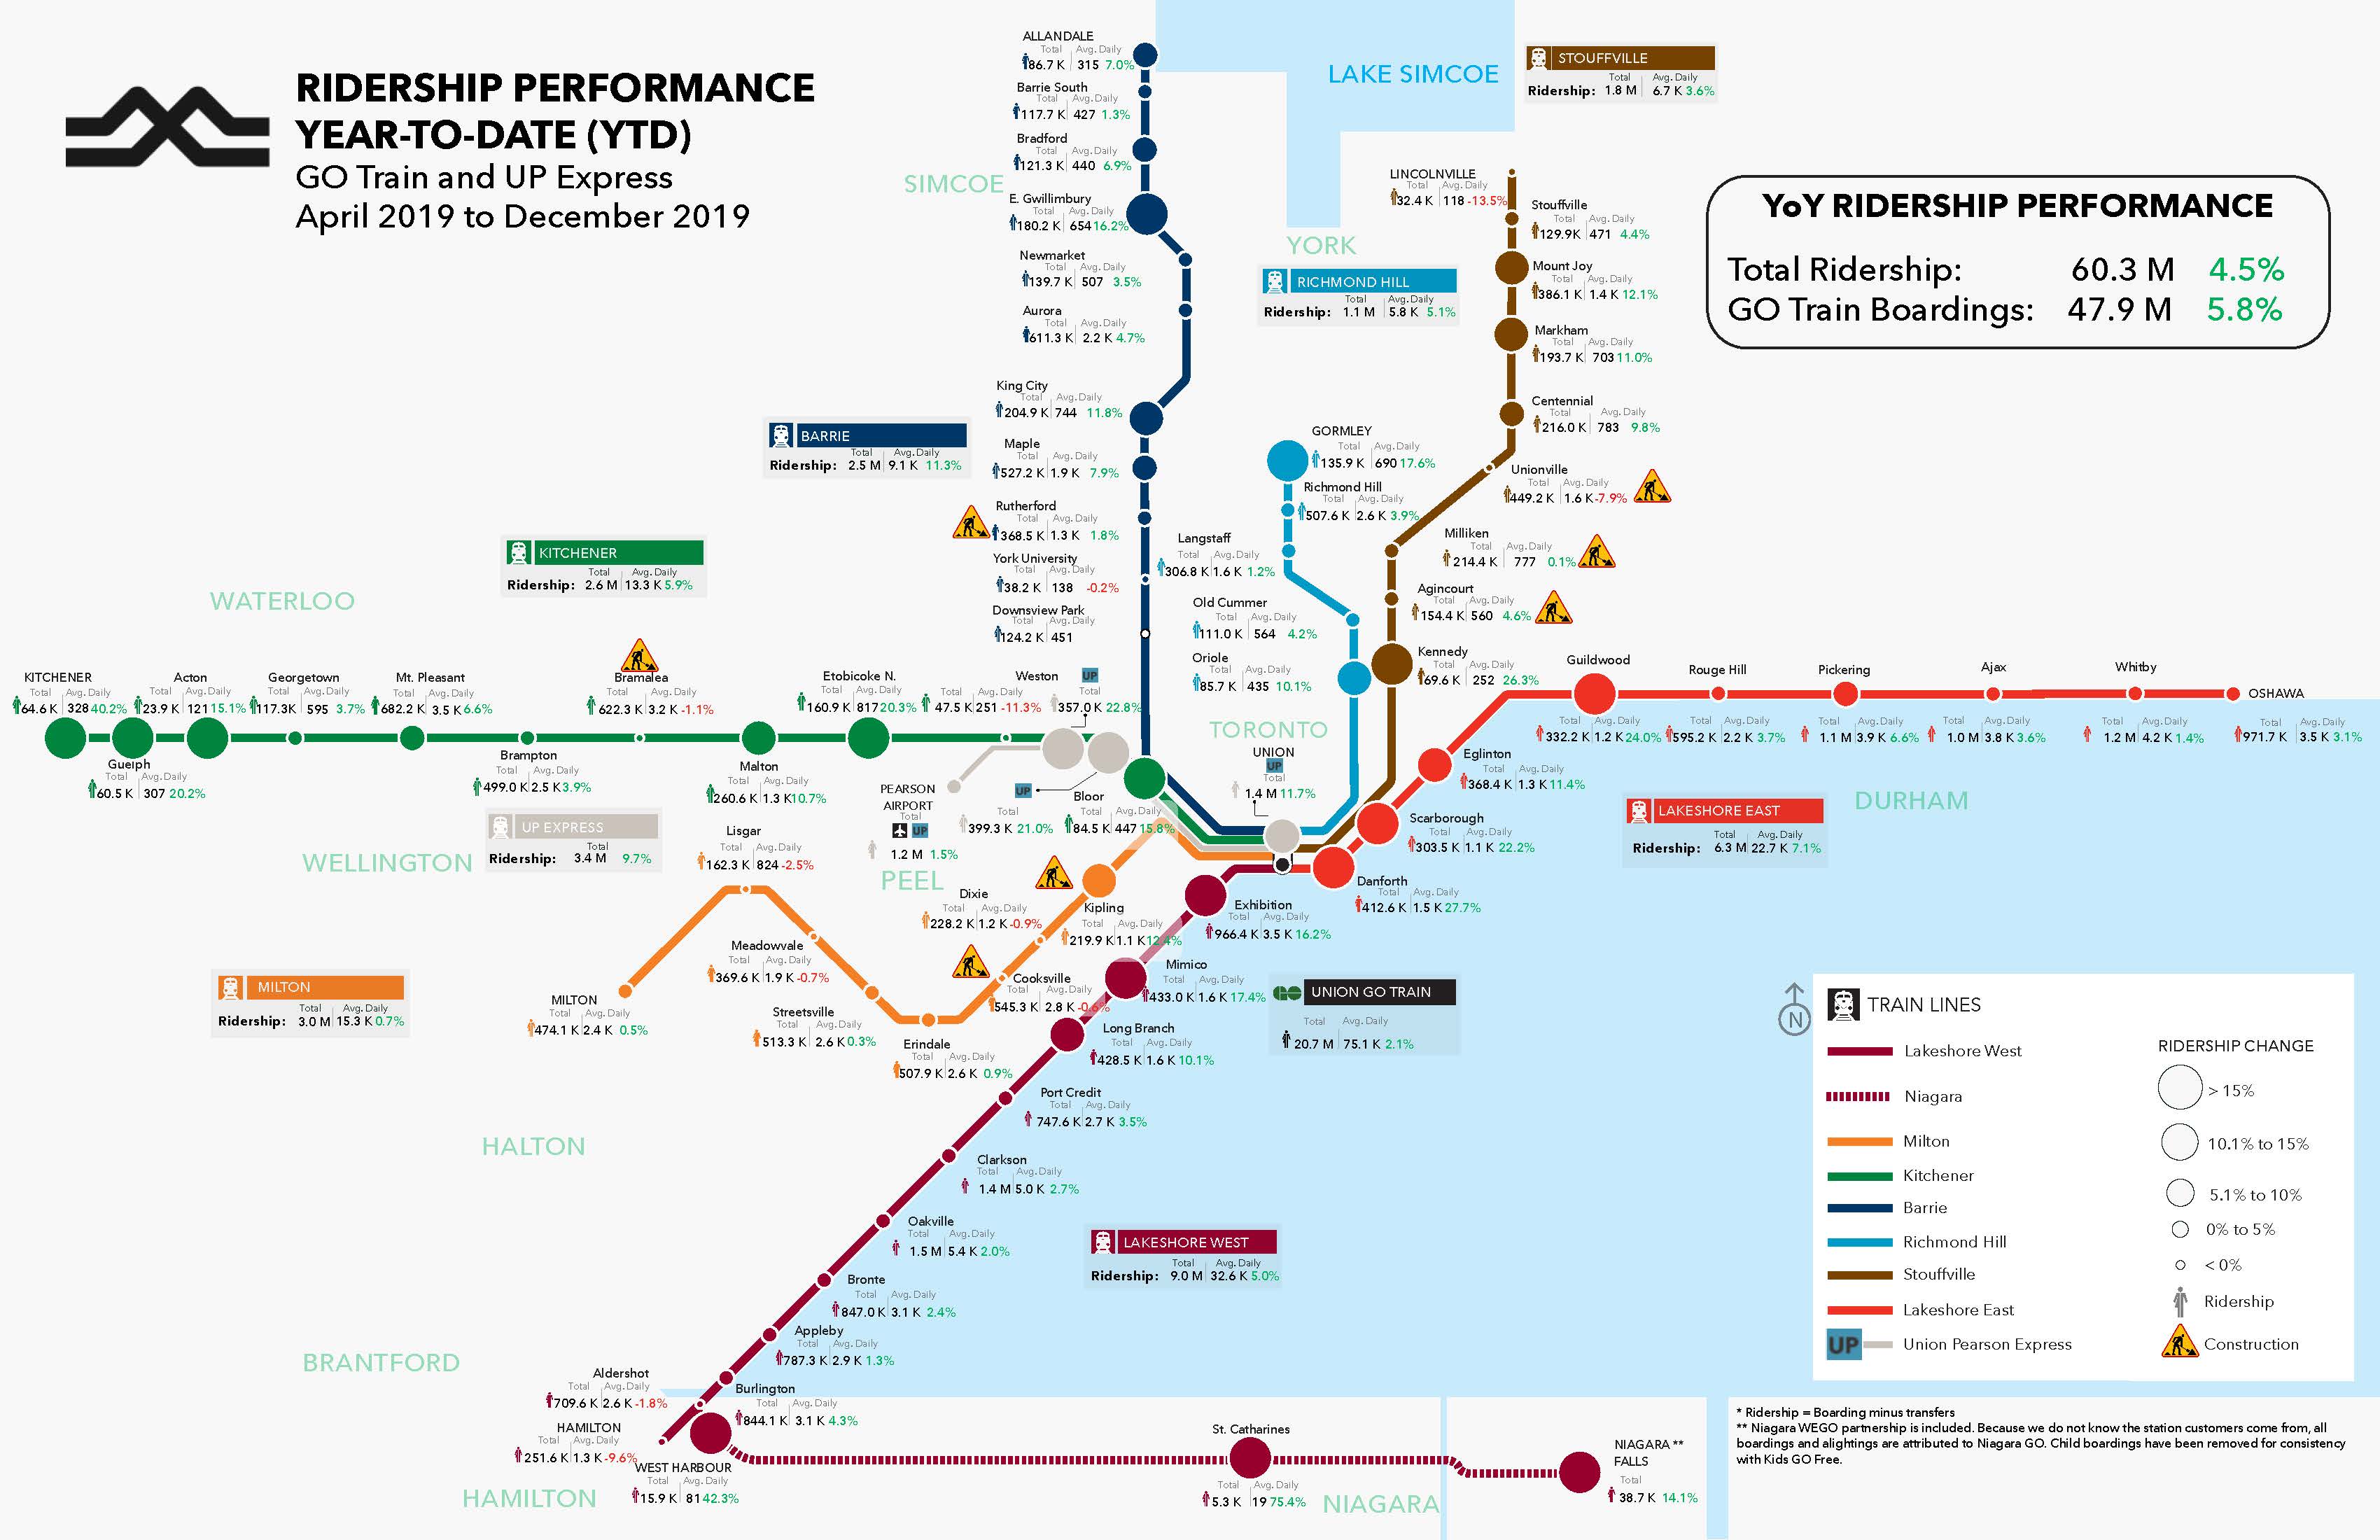
Here’s the latest ridership map. But for a closer look, click the link just below. (Metrolinx graphic)
CLICK HERE TO SEE THE ABOVE RIDERSHIP MAP IN DETAIL
And the most interesting shifts in travel habits haven’t been the usual commuter, rush-hour trips, moving in and out of Toronto’s Union Station.
Mark Childs, chief marketing officer for Metrolinx, said offering customers more service and reasons to travel outside of rush hour service have been crucial for encouraging more people to choose GO.
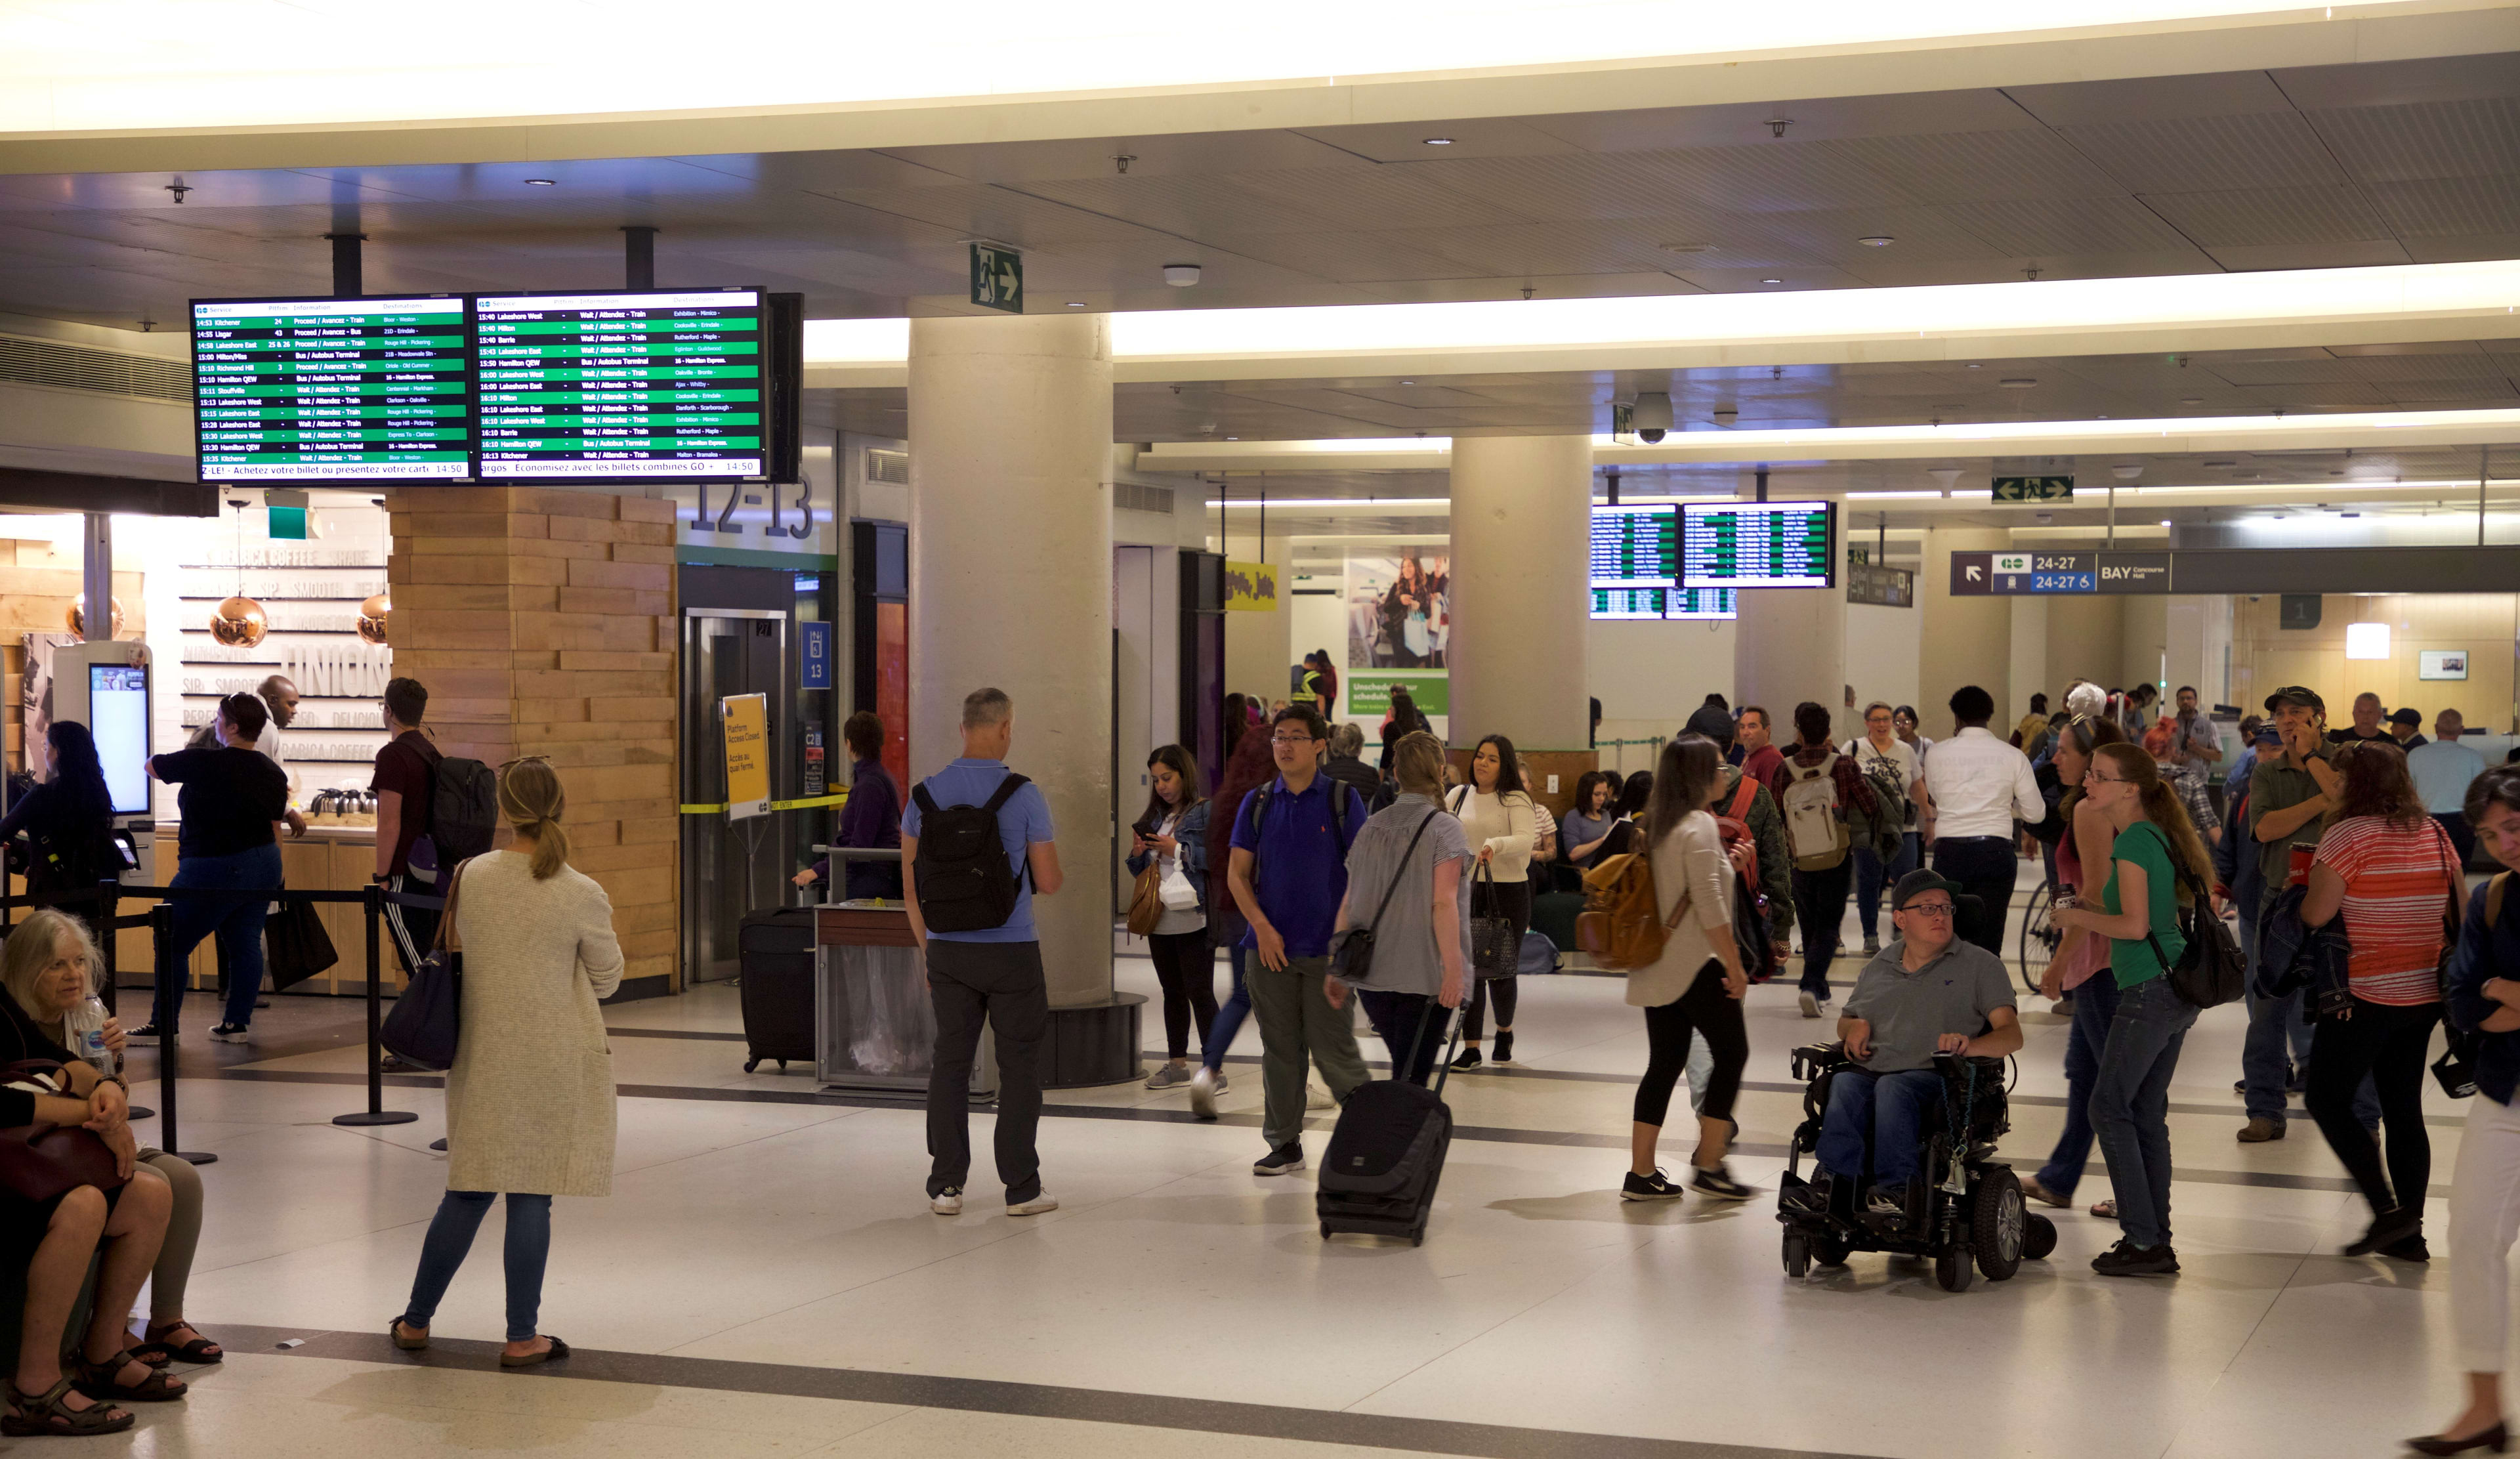
GO and UP Express customers are among those making their way through Toronto’s Union Station, in this file image. More are taking trips during off hours, a new report shows. (Scott Money photo)
That weekend and off-peak weekday ridership on GO is growing more than three times as fast as peak times.
“We’re thrilled to see such a great response,” Childs said.
“Additional weekend service, lower short distance fares and the new Sunday Funday $10 pass are helping boost our ridership demand. We introduced weekend service to Stouffville in 2019, which led to a 7.9 per cent increase in ridership on that line.
“Bringing our long-standing and new partnership events to life such as Cirque du Soleil, Santa Claus Parade and combo event offerings provided new ideas and incentive for our customers to choose GO during the holidays.”
As an example he pointed to the 168 per cent increase in attendees who took GO to the One of a Kind Show at the Enercare Centre in November and December 2019 versus in 2018.
In total, more than 6.5 million riders jumped onboard per month in the fall – with September, October and November 2019 coming in as among the highest ridership months on record.
And December 2019 had the strongest year-over-year growth at 8.3 per cent, compared to December 2018.
Other notable stats include:
- A 26.4 per cent growth in weekend ridership to and from stations close to Union.
- So far this year, Danforth, Scarborough and Kennedy continue to be popular, with 27.7 per cent, 22.2 per cent and 26.3 per cent more customers boarding at those stations.
- Almost 10 per cent more customers took UP Express so far this year.
The Sunday Funday flat fare travel pass was popular amongst weekend revelers. More than half of the customers used the pass between 2 and 5 p.m.
Check out the updated ridership map to see how your station performed this quarter, and to see the latest board material, just click here.
by Suniya Kukaswadia Metrolinx media relations senior advisor